NRL Performance Timeline
We built a timeline that tracks the performance of all teams in the NRL in three dimensions.
As an exercise in the possibilities 3D brings for data visualisation and interrogation we built a timeline that tracks the performance of all teams in the National Rugby League competition since 2015. The timeline allows users to track their team against others, interrogate the form of their team at every round, filter comparative teams in or out and see the GF winners at the end of each season all in one timeline.
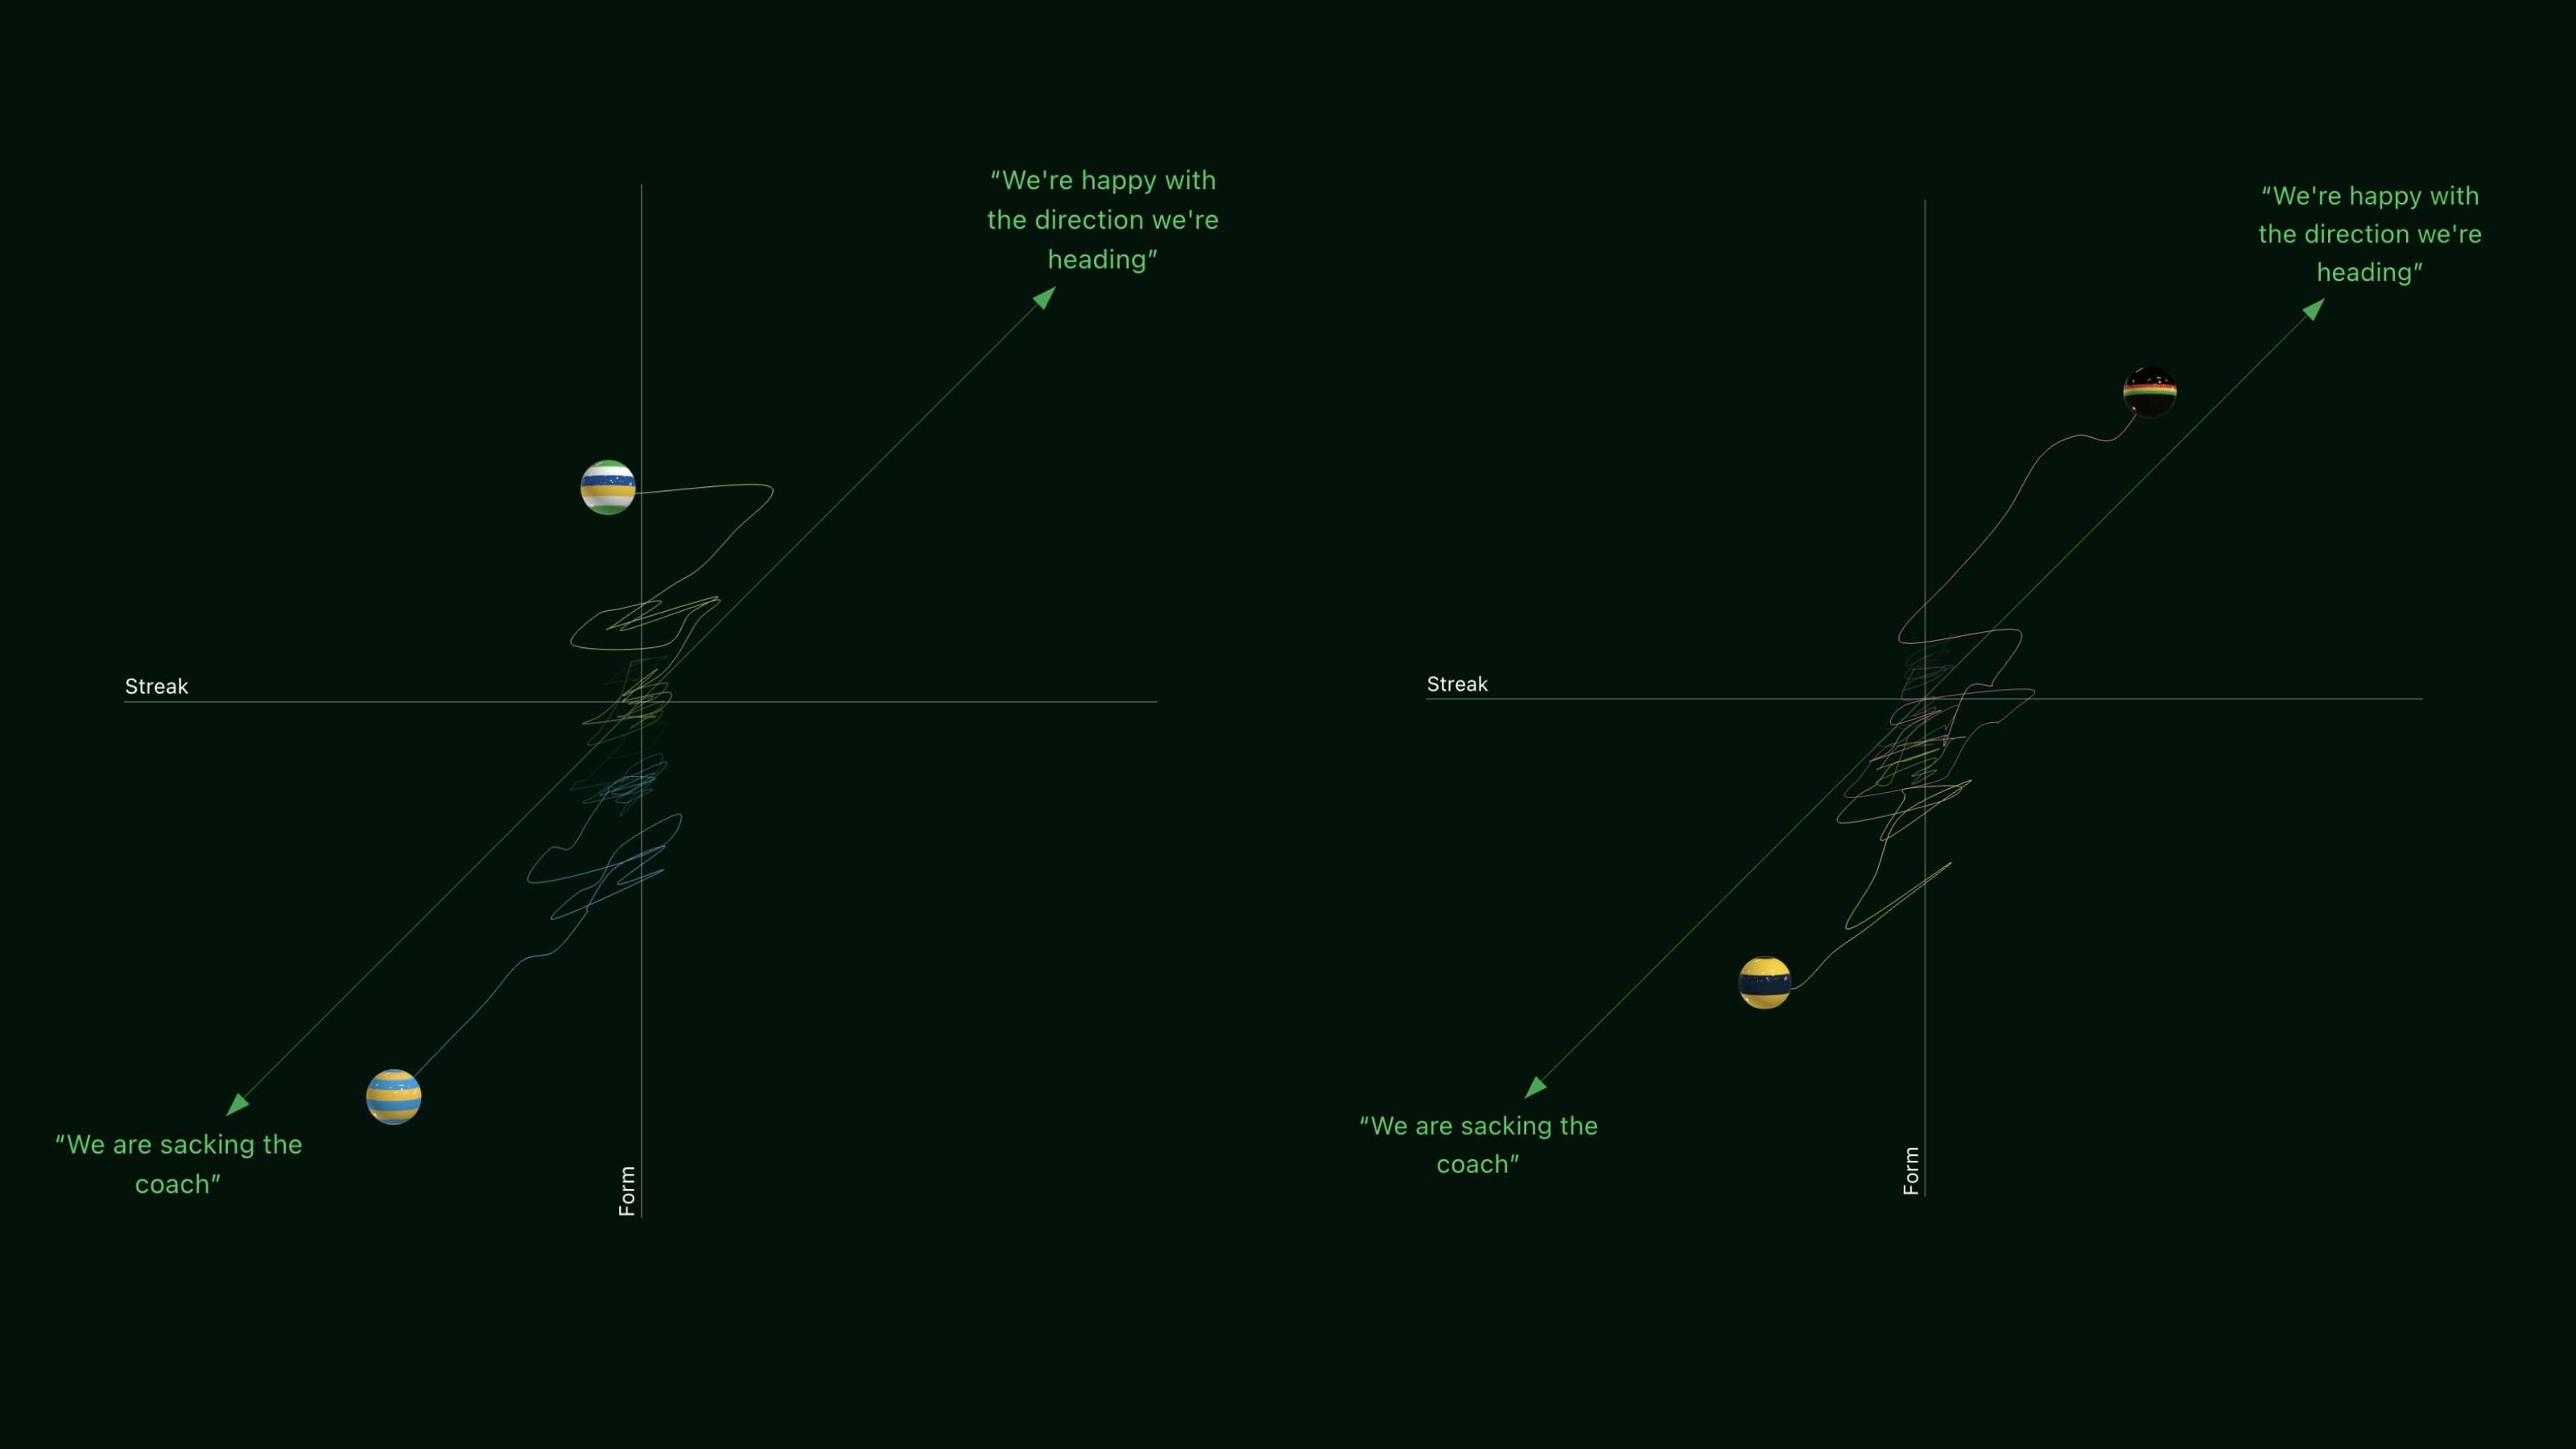
The starting point for this work was a form algorithm based on Google’s page rank algorithm. We plotted that form along one axis of our graph and the team’s streak of wins or losses on the other. Looking down the x-axis brought another dimension to the work - a unique fingerprint of a team’s performance over time, tracking their form and their streak in the same view.
About the form algorithm
The NRL-Form algorithm is a tool for quantifying how well a rugby league team is performing based on past results. Simple statistics like Win Percentage or For and Against can be useful, but are limited since they do not consider the quality of opposition.
Background
NRL-Form is loosely based on Google's famous "PageRank" algorithm - the secret sauce that has enabled them to dominate Web Search for two decades. Prior to this development, most web pages were scored based on their content, but Google's innovation was to instead focus on the quality of web pages hyperlinking to a page. When applied to Rugby League, the key takeaway is that a team's form should not be solely based on their win/loss record but also the form of the teams they win and lose to. For example, beating the Penrith Panthers in 2022 was a much greater indication that a team was doing well than beating the Gold Coast Titans.
How Does It Work?
This is an iterative algorithm. To calculate the form of each team at a given point in time, we begin by assigning all teams a score of 0. We then go through each team and adjust their form score based on all previous matches. For each match we consider:
- The winning/losing margin
- The form of the opposition
- The recency of the result
- This process is repeated until all the form scores converge.
Interrogating data in the 3D space
Three dimensions affords us the possibility to look at data in new and interesting ways. Rotating the view allows us to have form and streak plotted by the one curve per team. Looking down the x axis allows us to see both form and streak. This becomes a unique fingerprint of the team’s performance over time. This method could be applied to many different performance indicators. It is a great method of comparison between team and allows for a lot of data from a long period of time to be consumed at first glance.
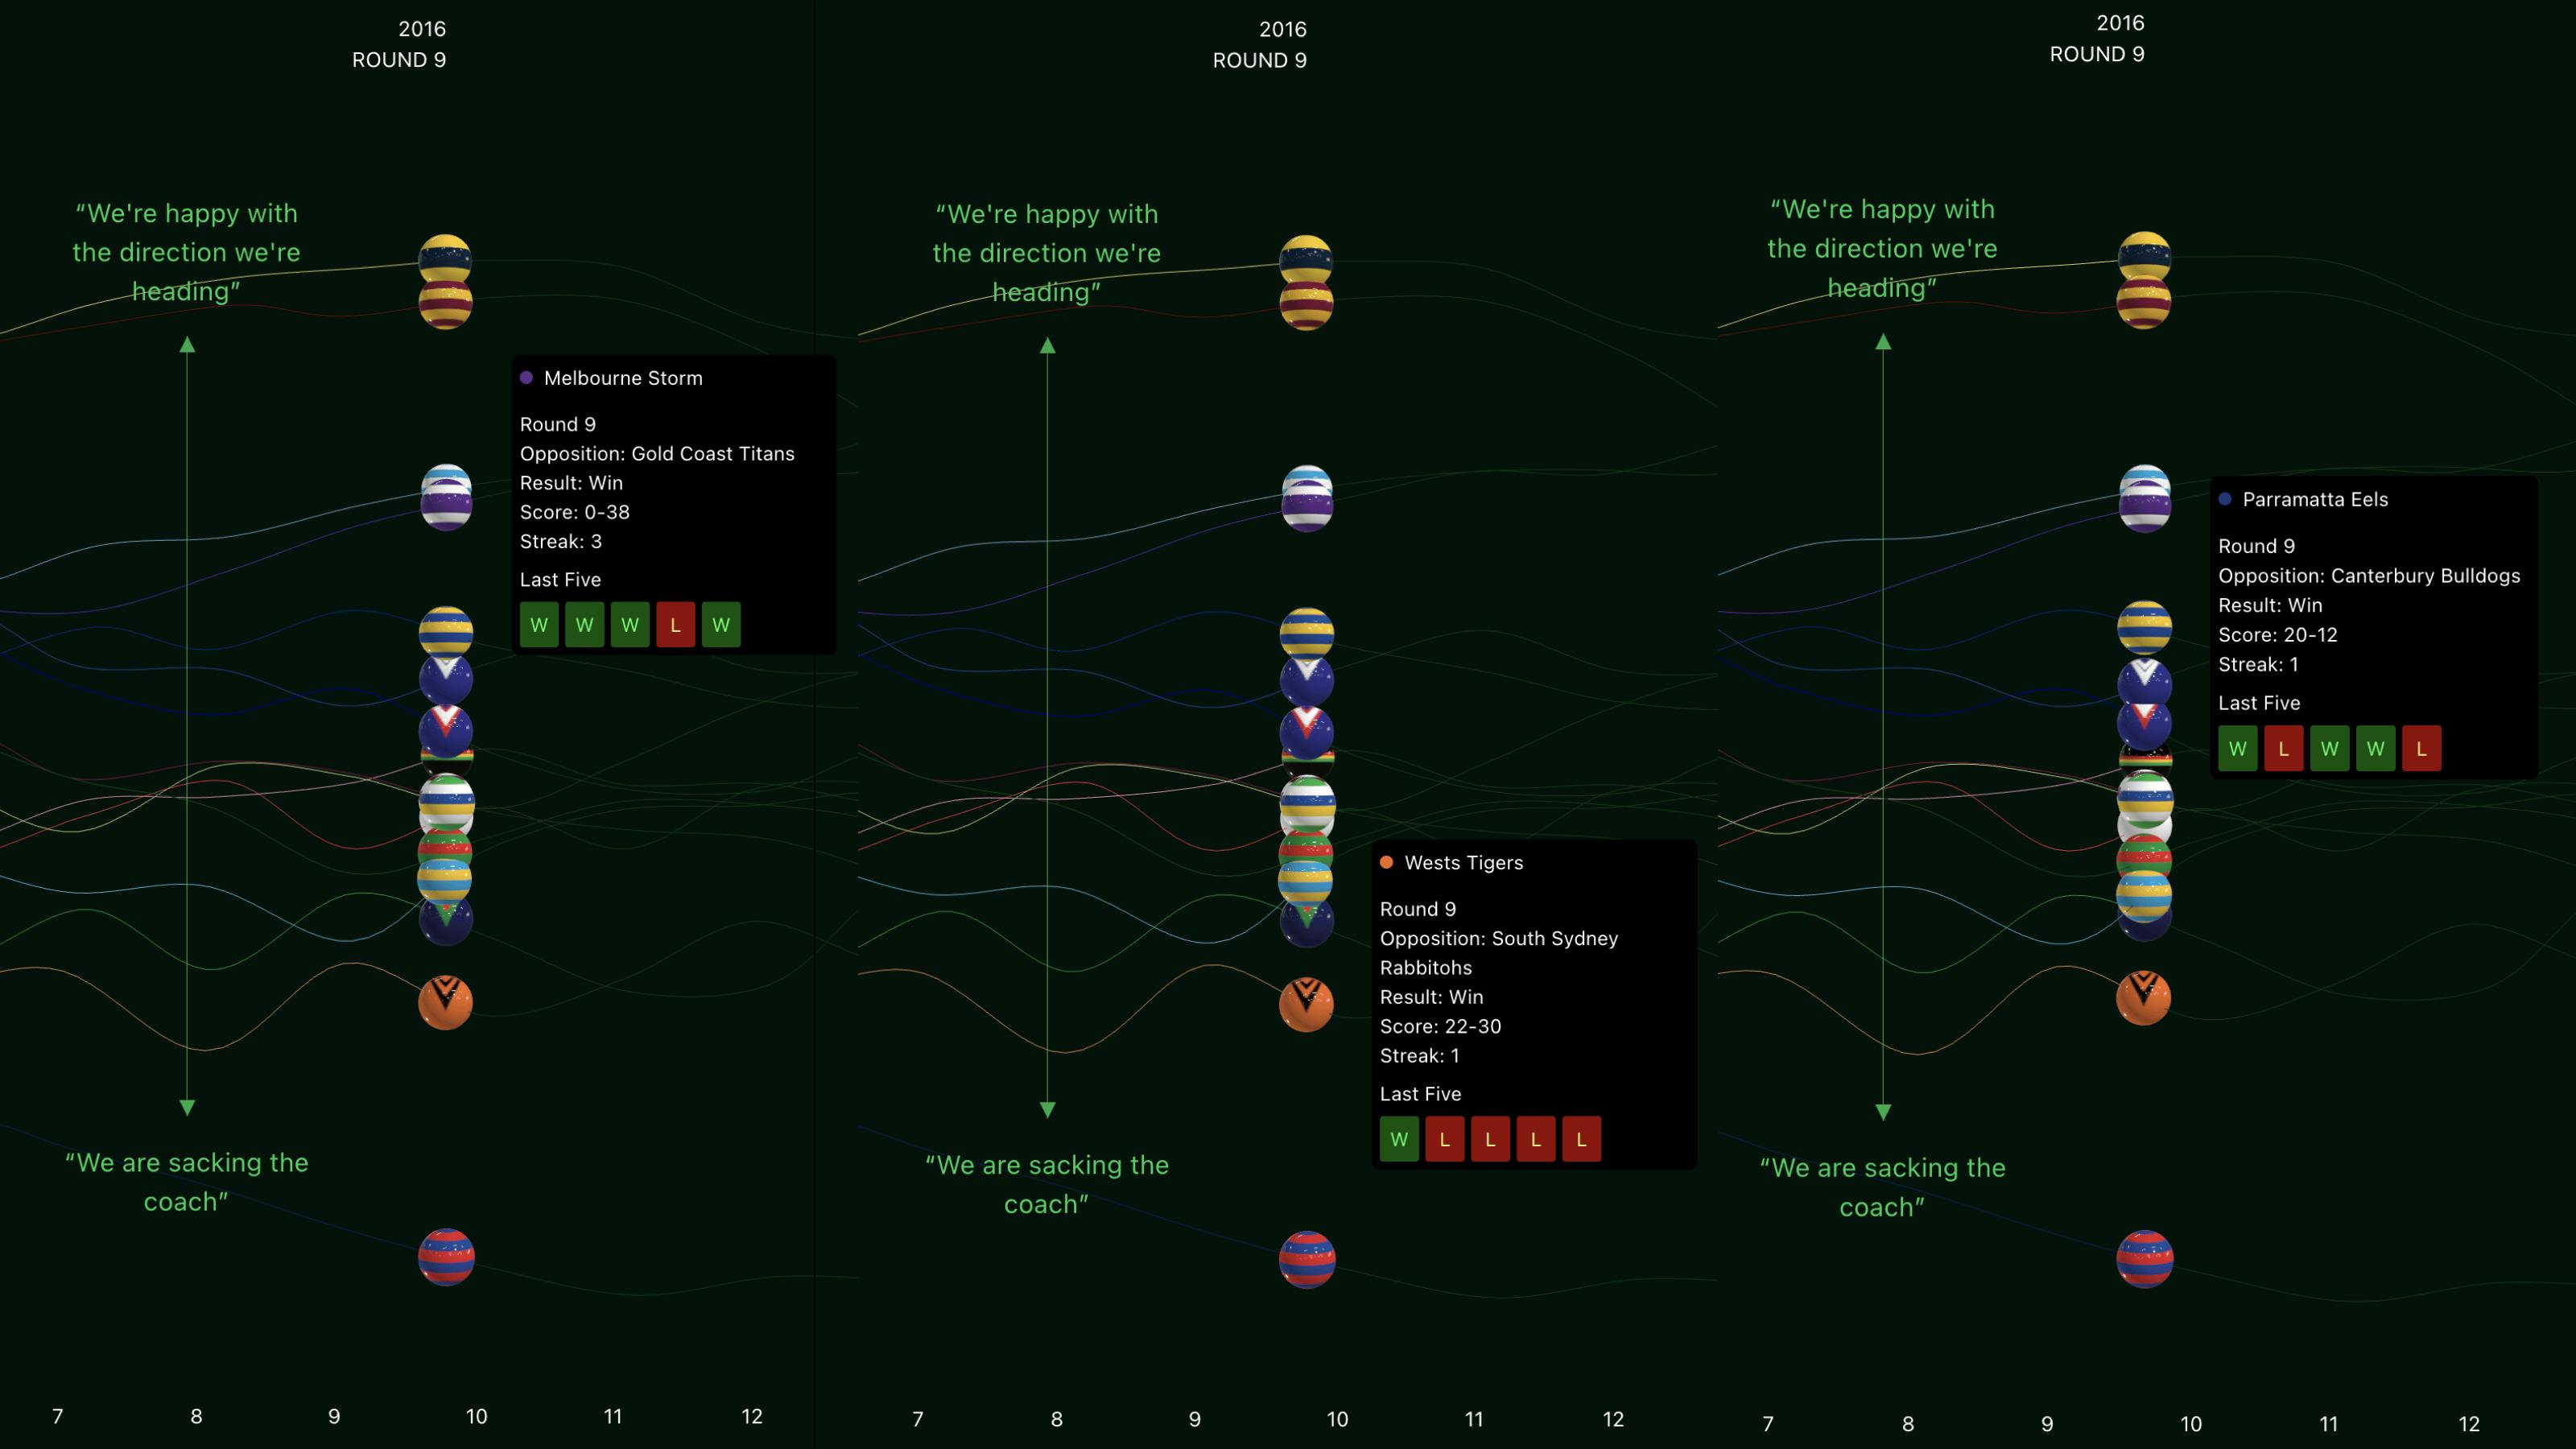
Team performance at a given round
Using the scroll-controlled timeline and showing team information at a given round with just a hover is a fluid and engaging way to explore your team’s performance. Seeing the performance of all your team’s rivals in the same view gives even more context to your team’s performance. Many other pieces of information could be surfaced at this point in time as well that could all go towards building an even more comprehensive picture of your team’s journey.
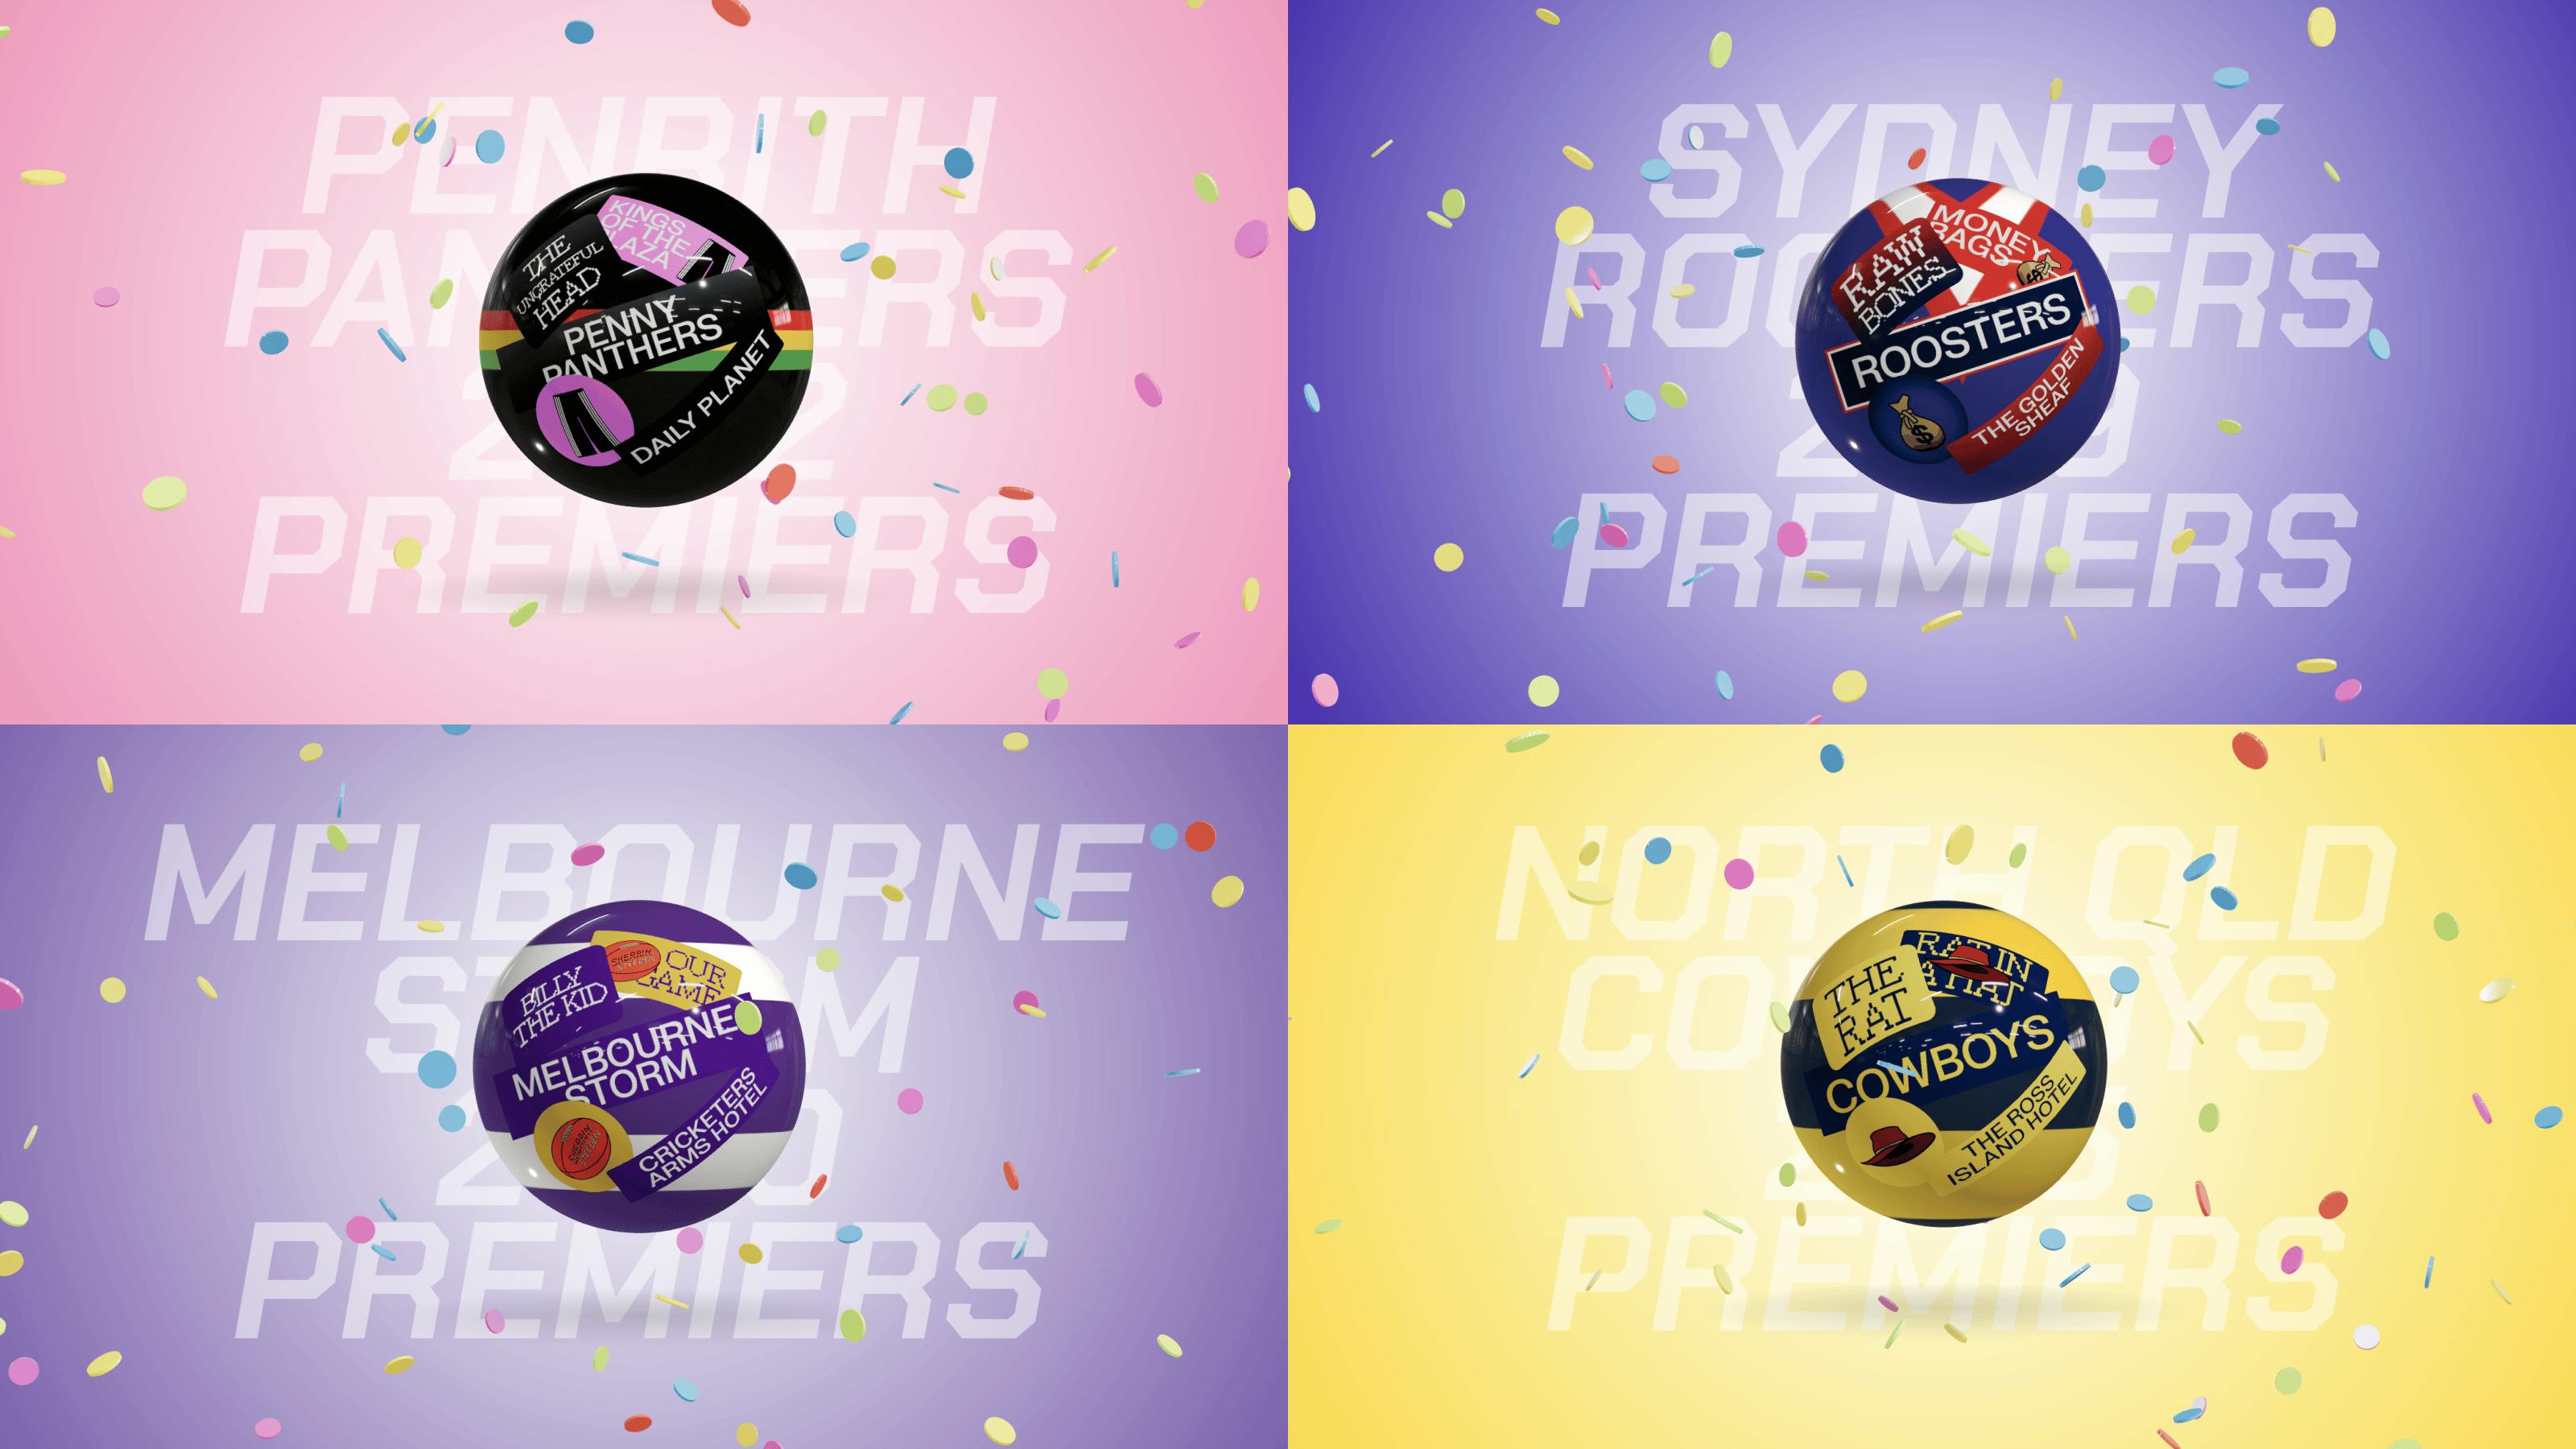
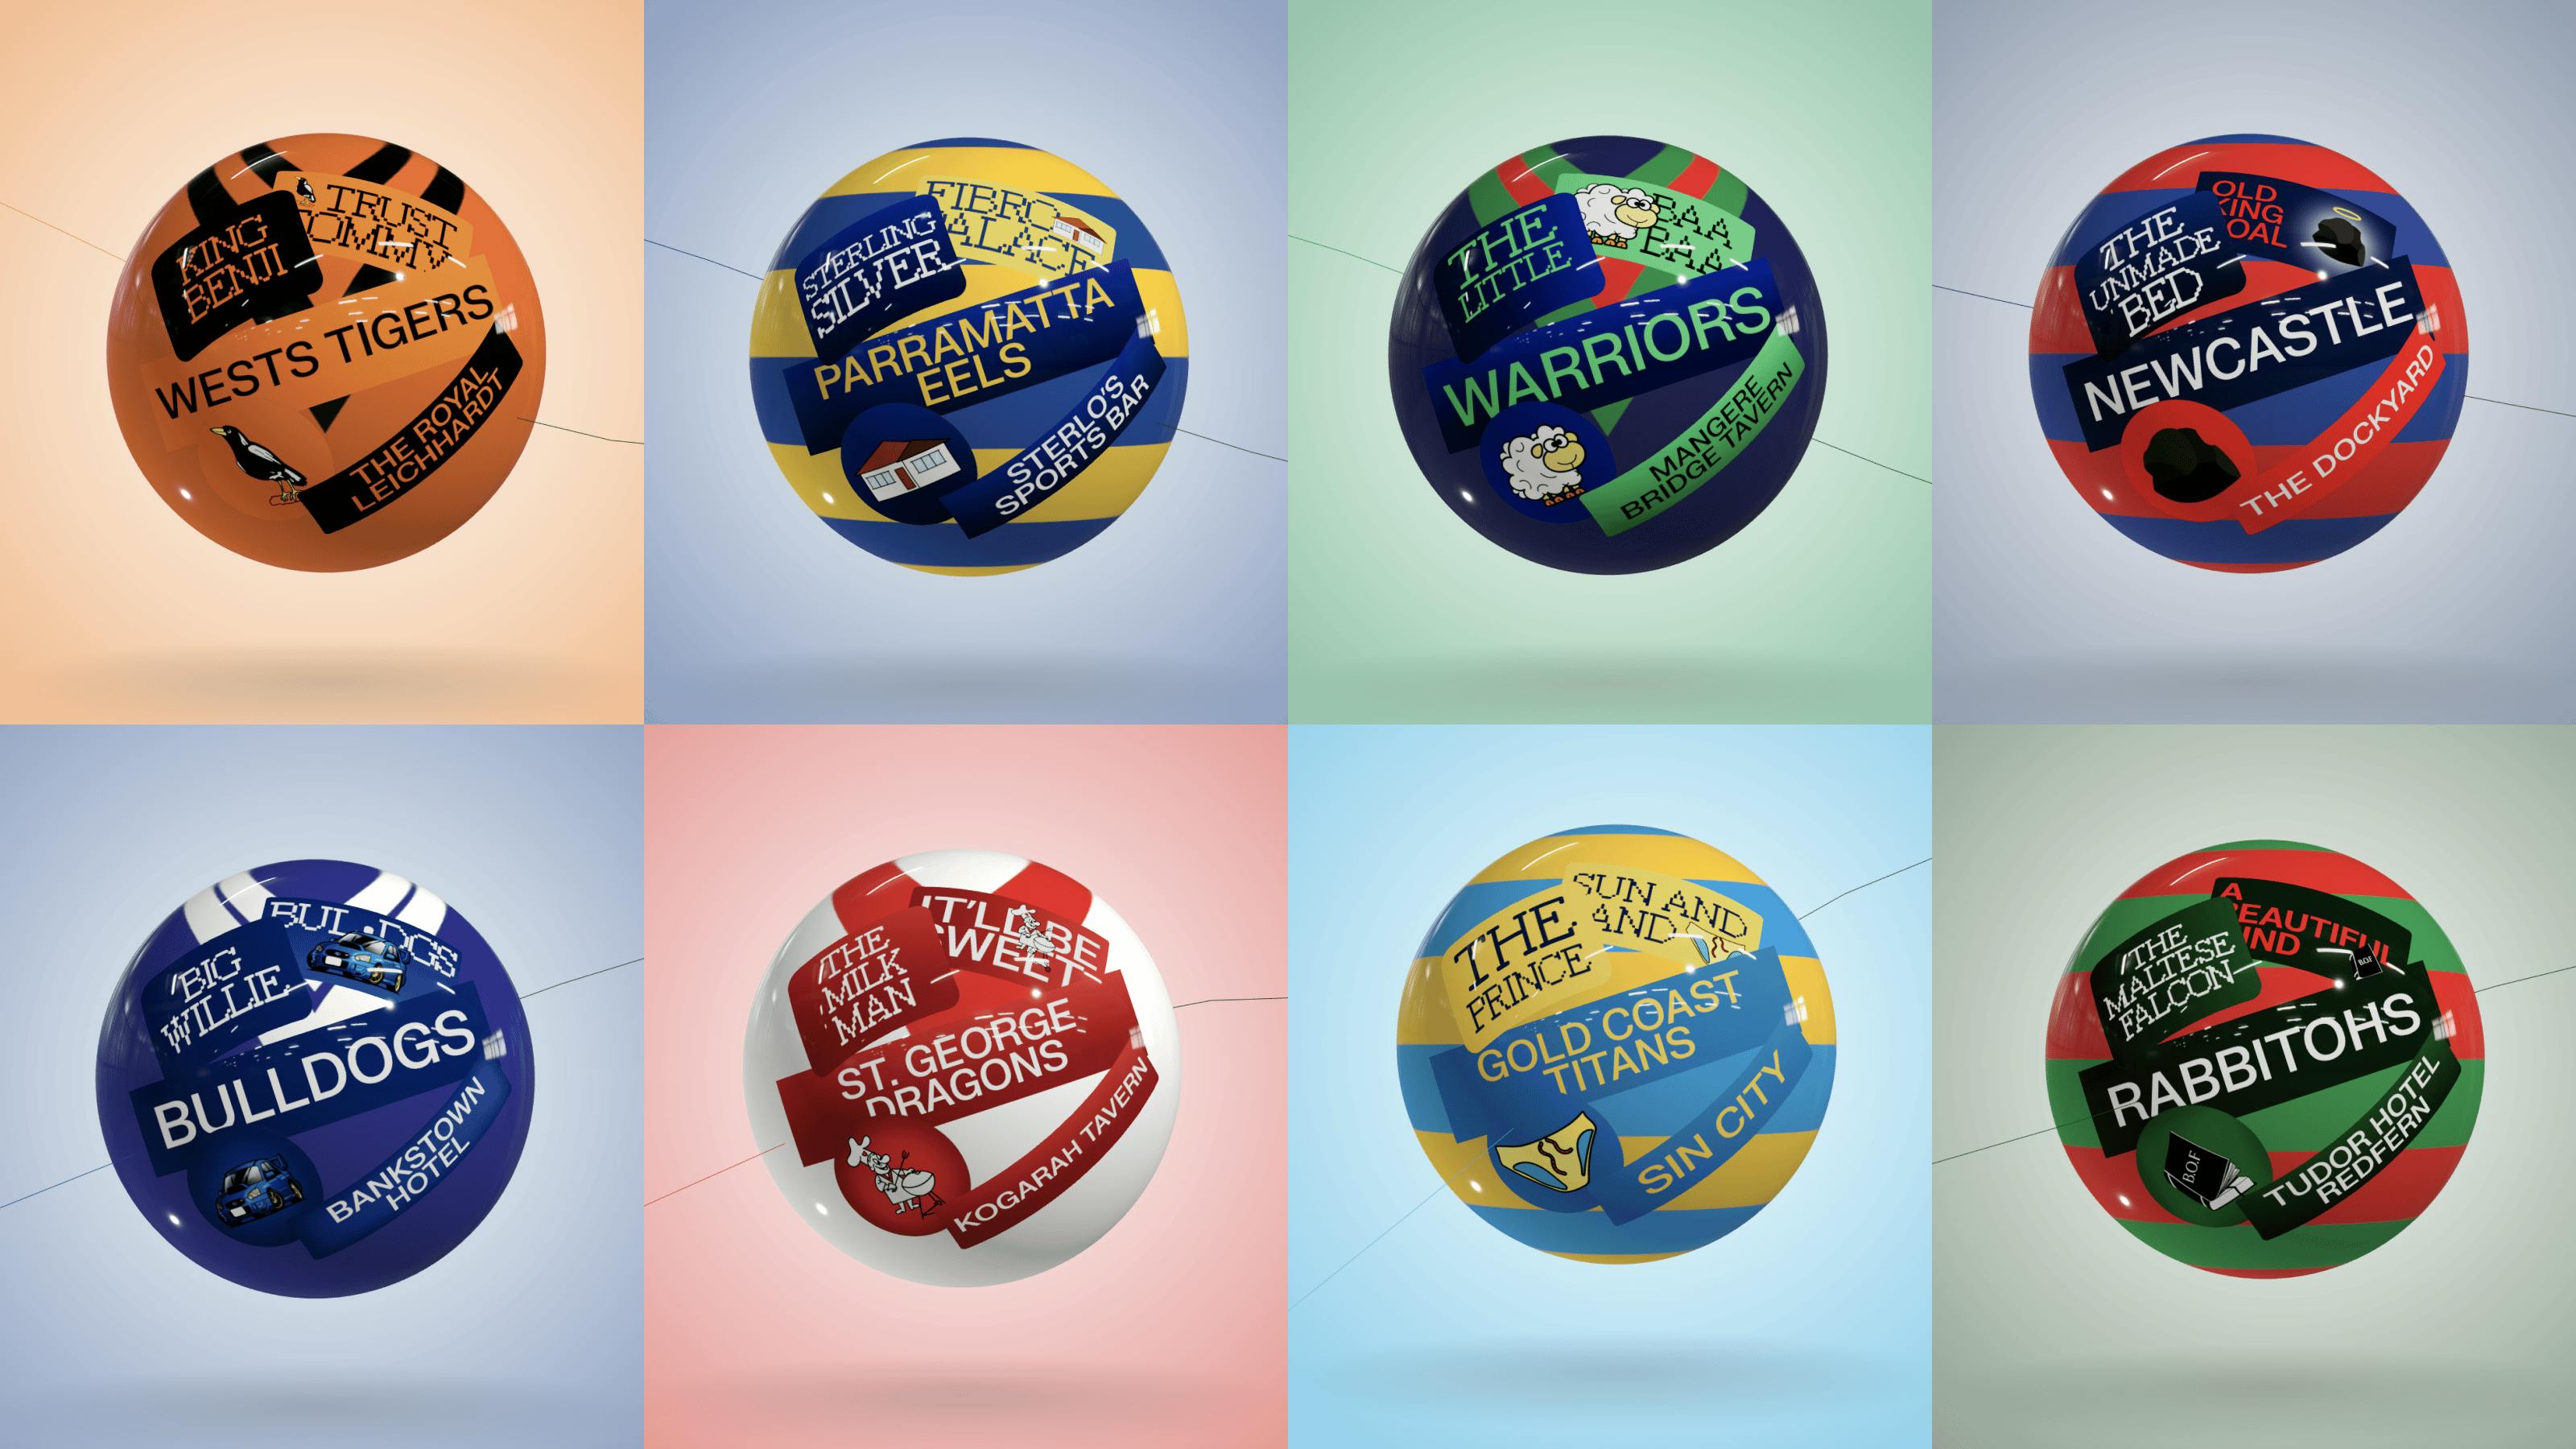
Design
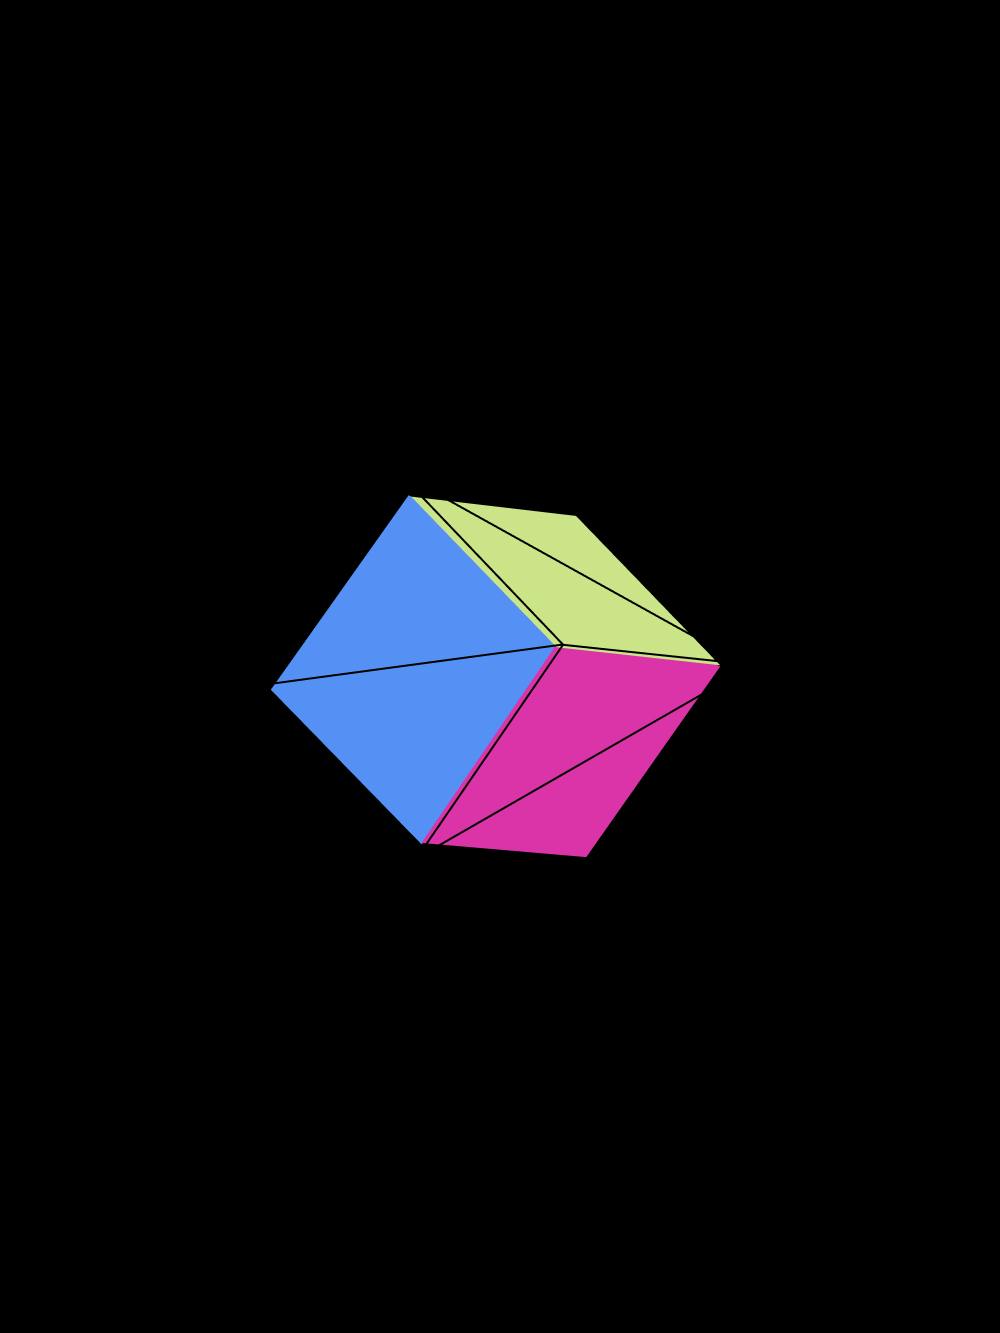
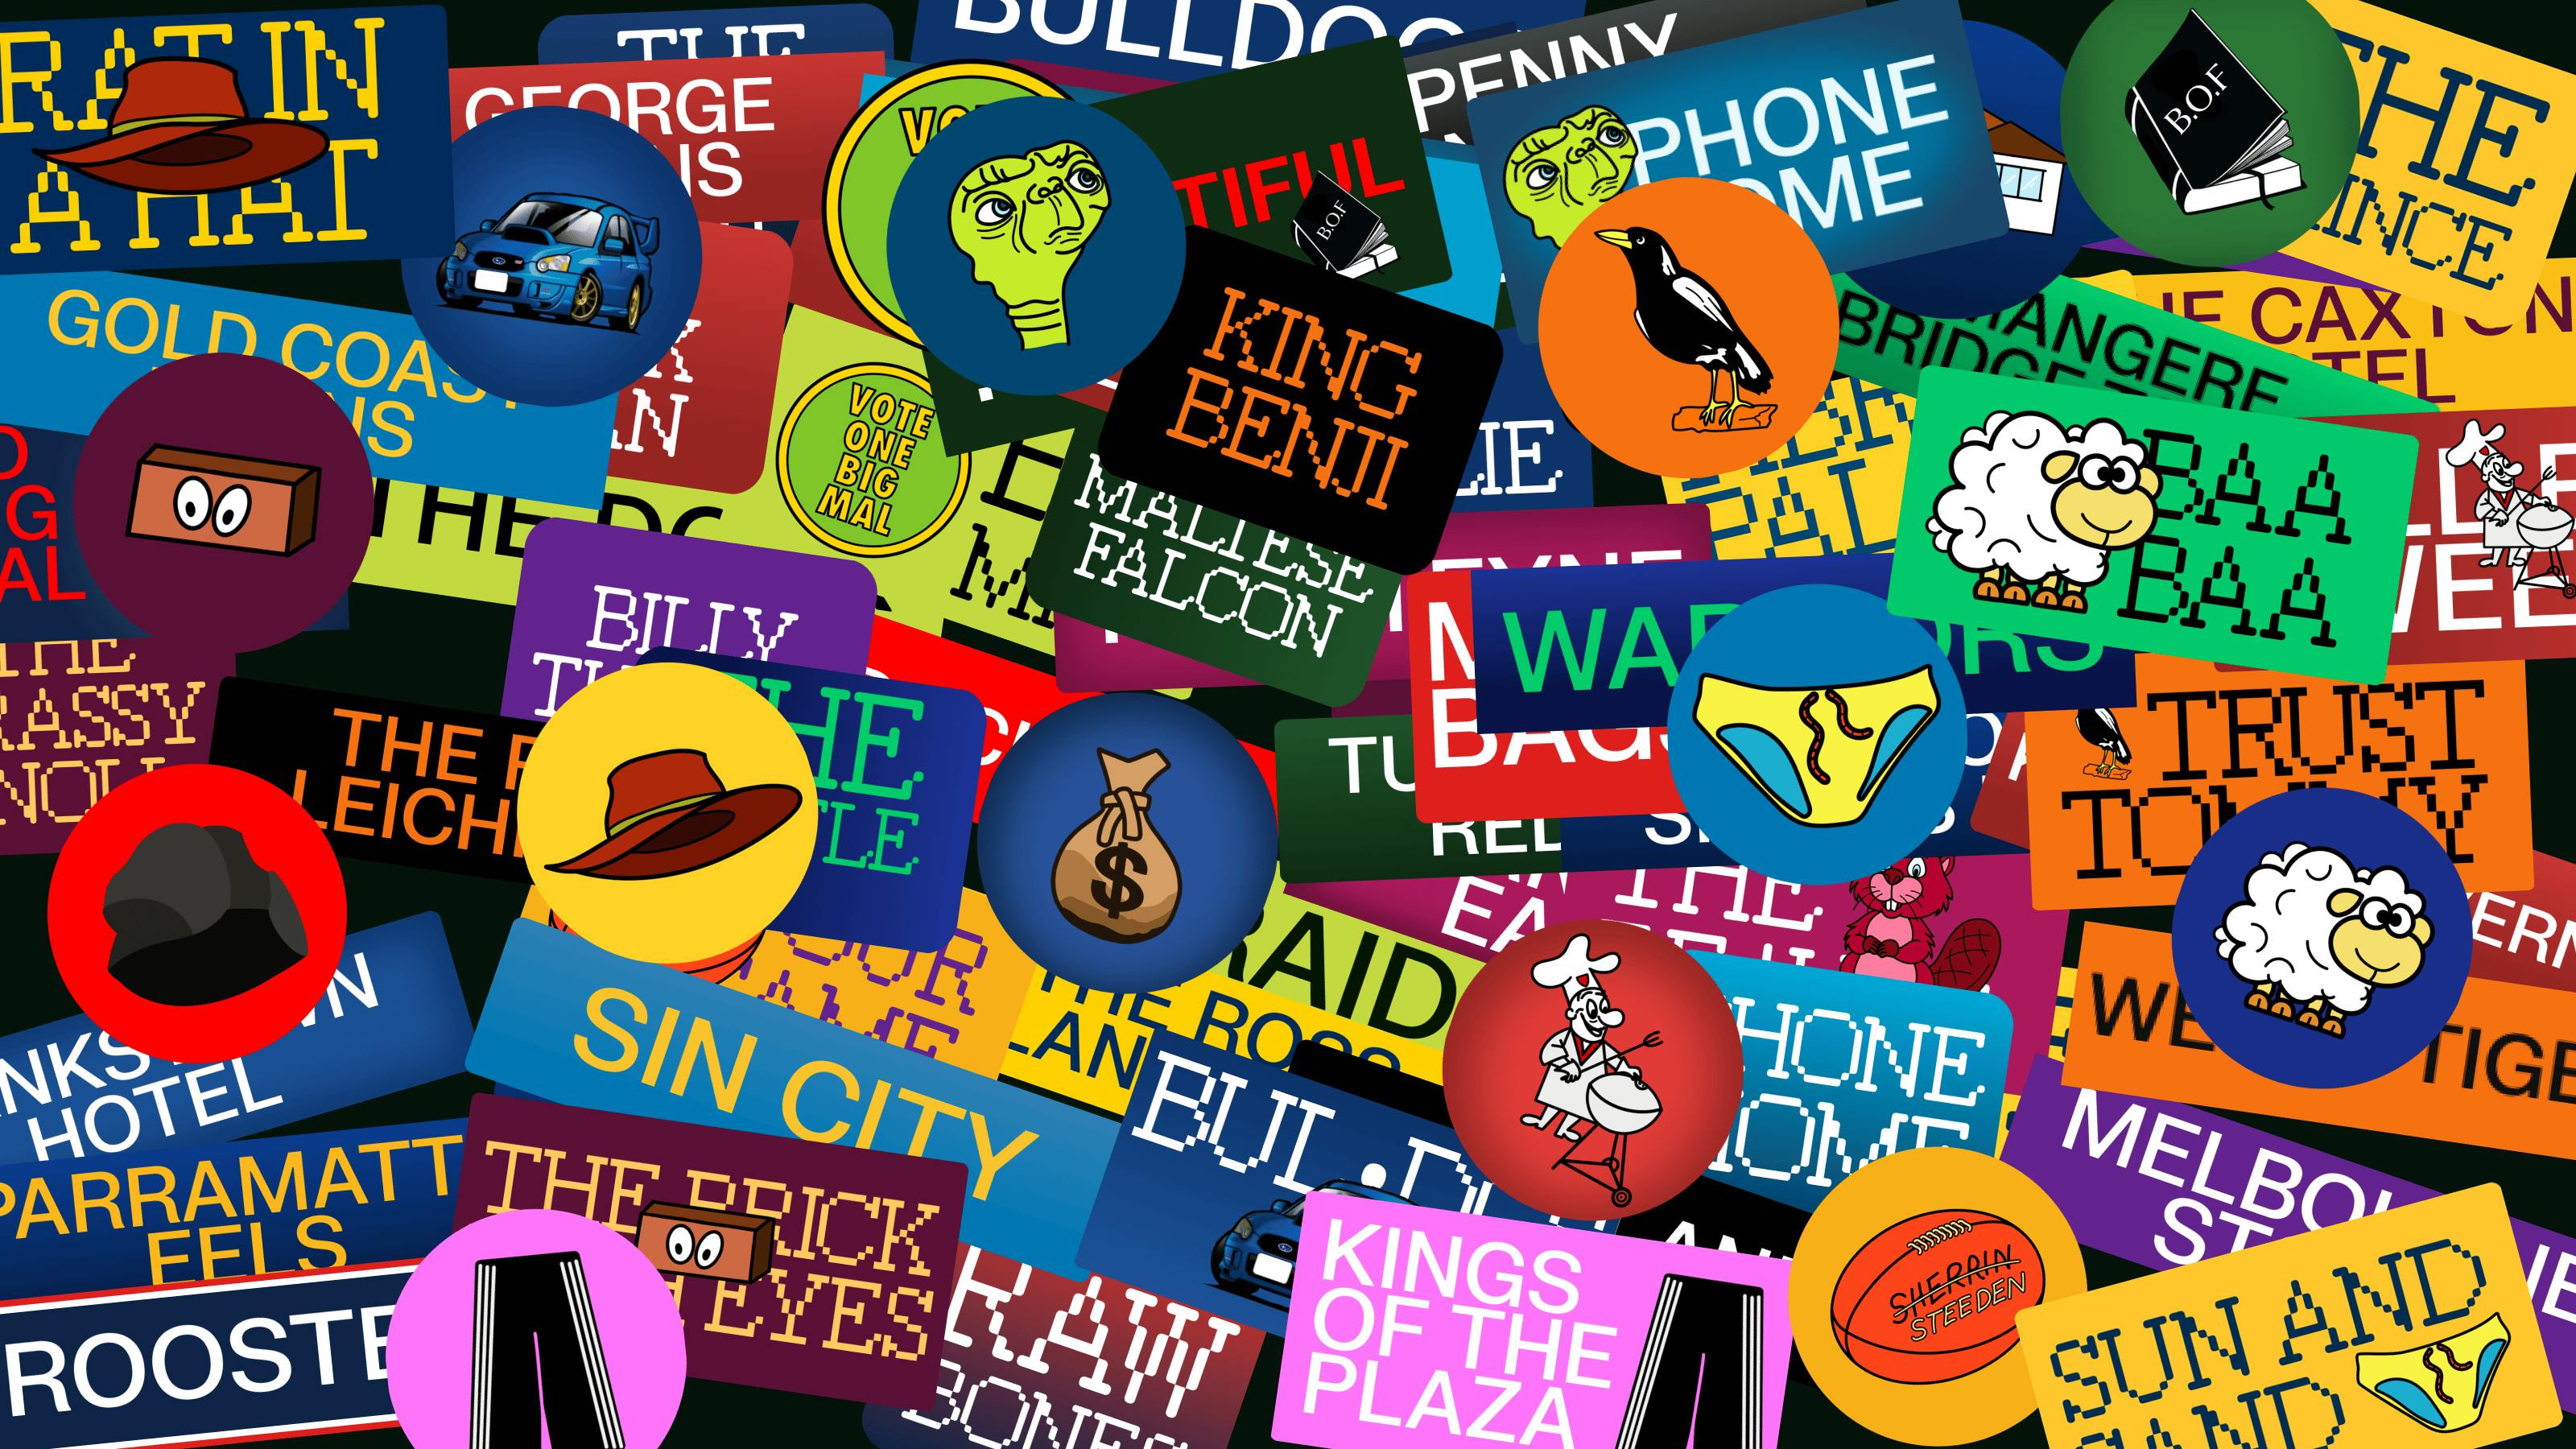
An elegant and minimal UI is paired with moments of magic when you click on your team or you come to a Grand Final. The use of hyper local team stickers is a nod to bumper bars of a supporters car. The use of 3D is what makes these moments. The floating confetti for the winner of the Grand Final and the high gloss, sticker covered spheres are a wonderful juxtaposition to the minimal UI.
Next steps
We are currently exploring this format as a way to explore even more of the interesting information that makes up the story of an NRL team. We can use this format as a storytelling tool for more than just performance. We can add pieces of important history to a club’s timeline. Their player movements, coaching changes, mergers, membership numbers are all things that a fan follows avidly. Having a place for these moments and data to be explored in an engaging way is a wonderful thing.
Credits & Related Content
Clients:
Partners:

Products: