NRL Performance Timeline forSupermarket

View Live Project
  • tag
    Data Visualisation
  • tag
    Visual Storytelling

Built with

React-three-fibreGreensock Animation PlatformDREIZustandReact

As an exercise in the possibilities 3D brings for data visualisation and interrogation we built a timeline that tracks the performance of all teams in the National Rugby League competition since 2015. The timeline allows users to track their team against others, interrogate the form of their team at every round, filter comparative teams in or out and see the Grand Final winners at the end of each season all in one timeline.

The starting point for this work was a form algorithm based on Google’s page rank algorithm. We plotted that form along one axis of our graph and the team’s streak of wins or losses on the other. Looking down the x-axis brought another dimension to the work - a unique fingerprint of a team’s performance over time, tracking their form and their streak in the same view.

About the form algorithm

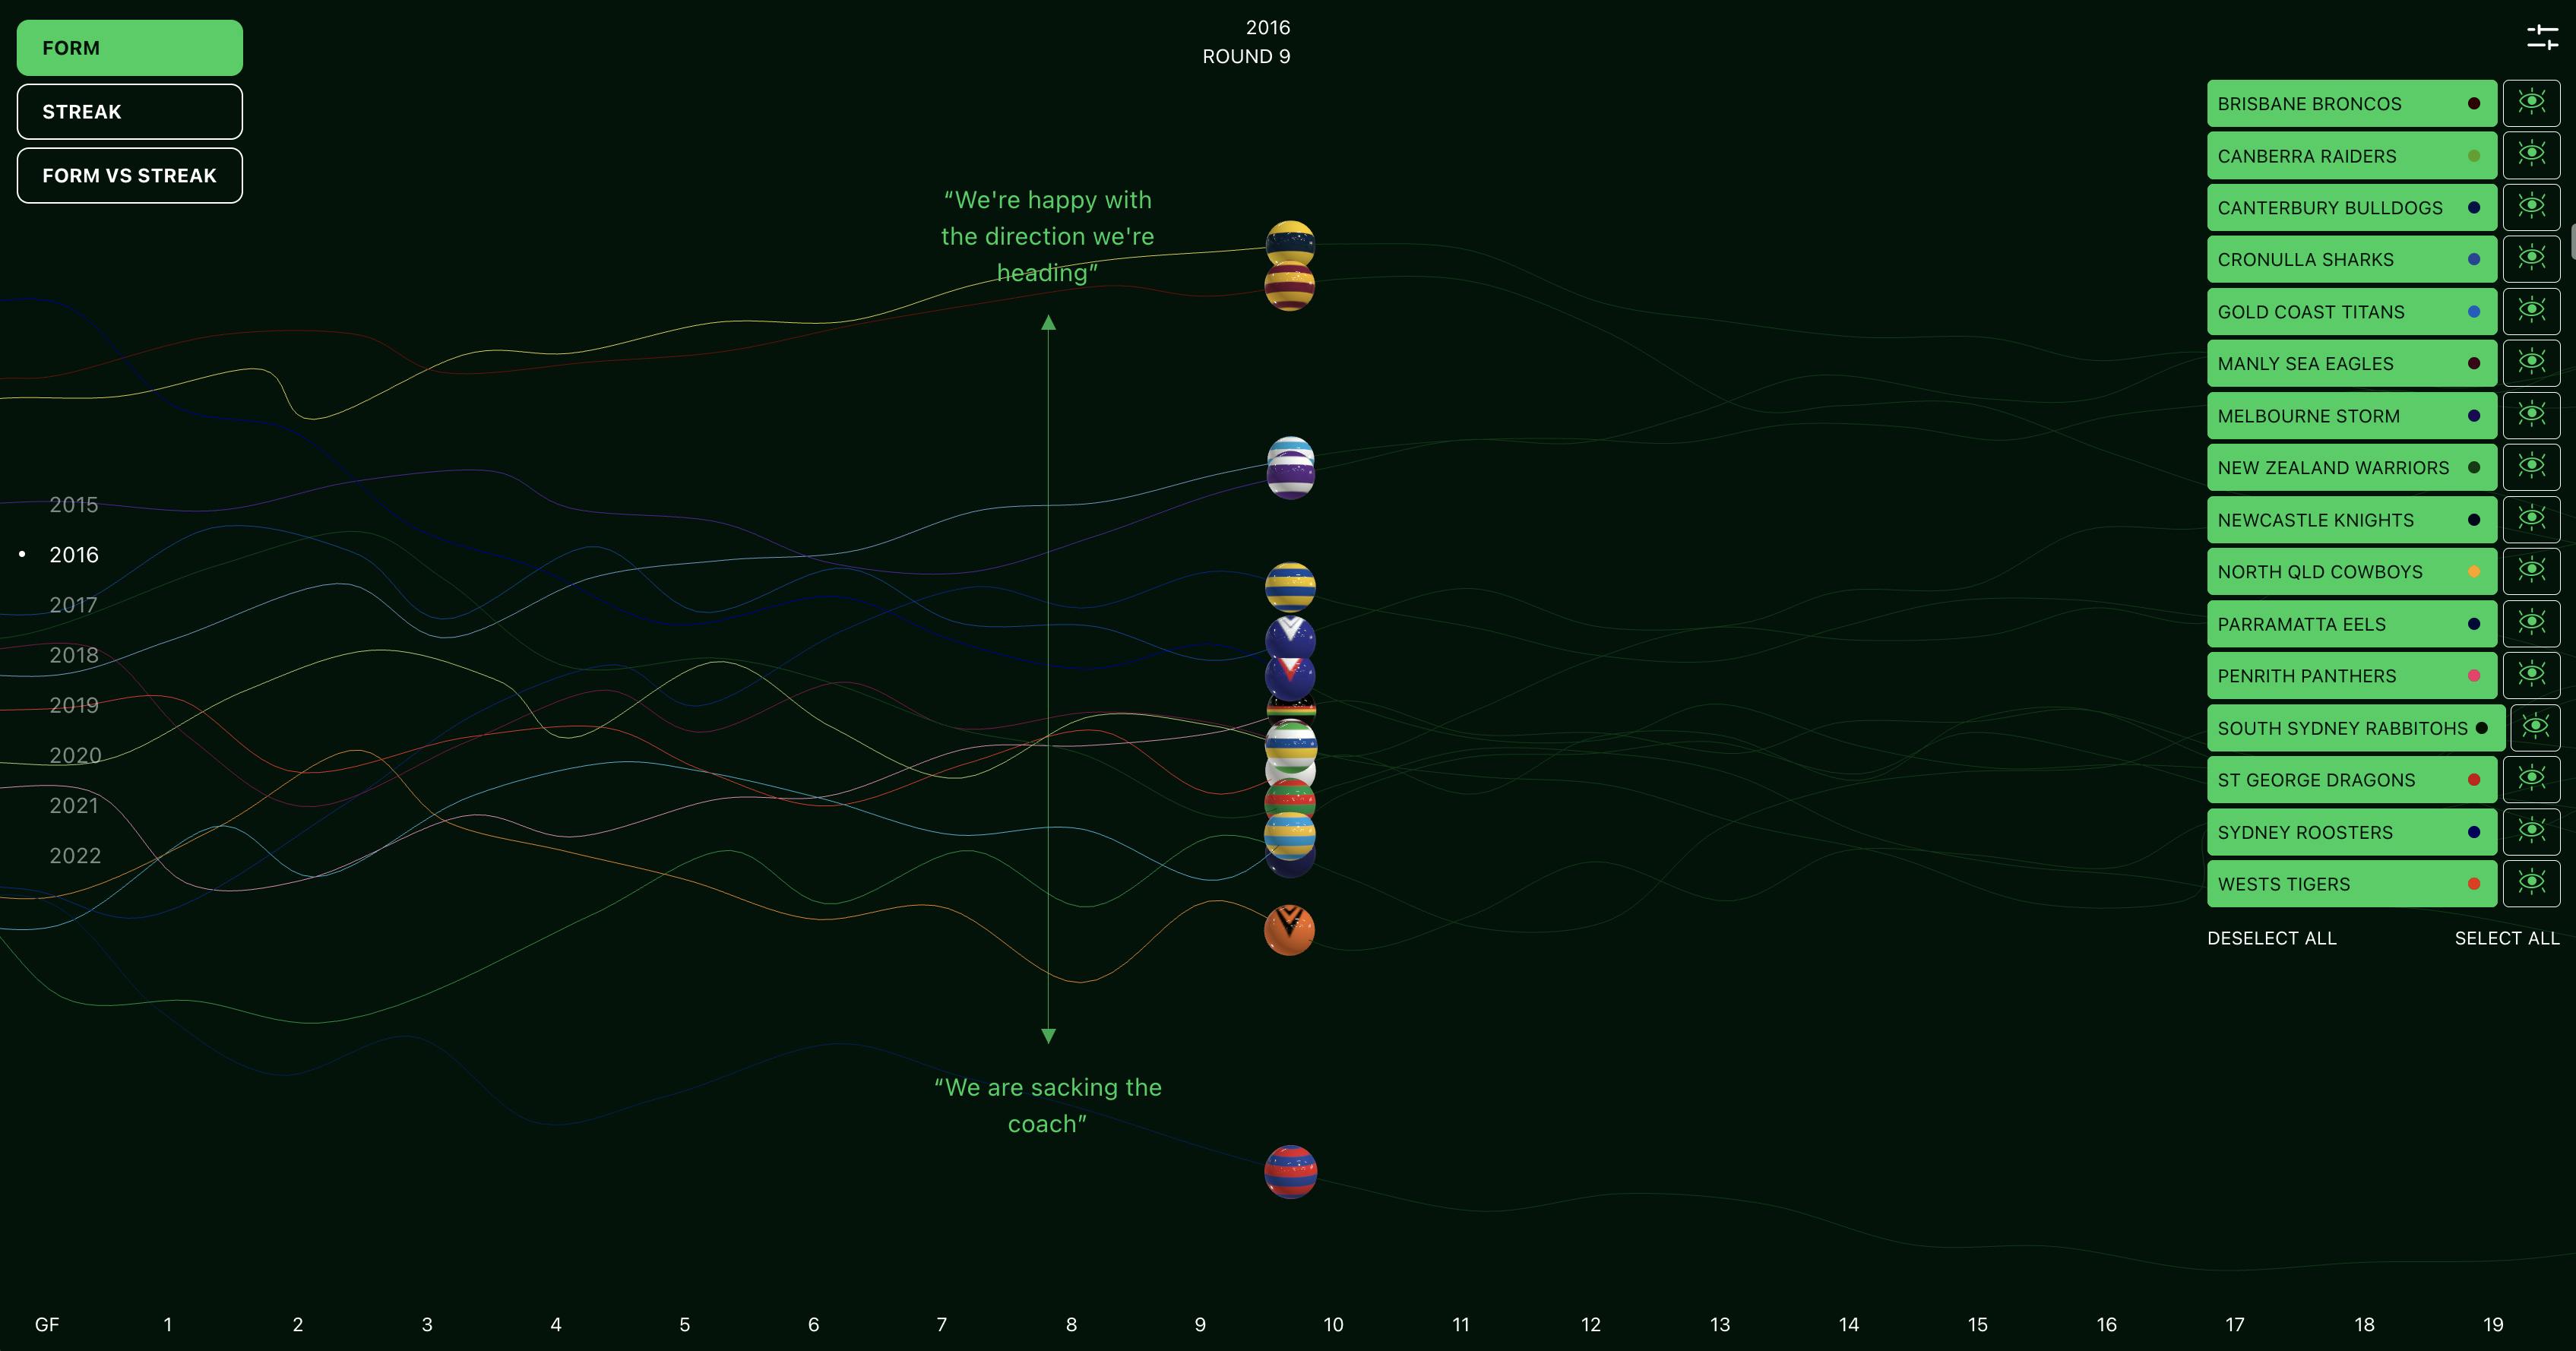
The form algorithm is a tool for quantifying how well a rugby league team is performing based on past results. Simple statistics like win percentage or for and against can be useful, but are limited since they do not consider the quality of opposition.

Our algorithm is loosely based on Google's famous Page Rank algorithm - the secret sauce that has enabled them to dominate Web Search for two decades. Prior to this development, most web pages were scored based on their content, but Google's innovation was to instead focus on the quality of web pages hyperlinking to a page. When applied to Rugby League, the key takeaway is that a team's form should not be solely based on their win/loss record but also the form of the teams they win and lose to. For example, beating the Penrith Panthers in 2022 was a much greater indication that a team was doing well than beating the Gold Coast Titans.

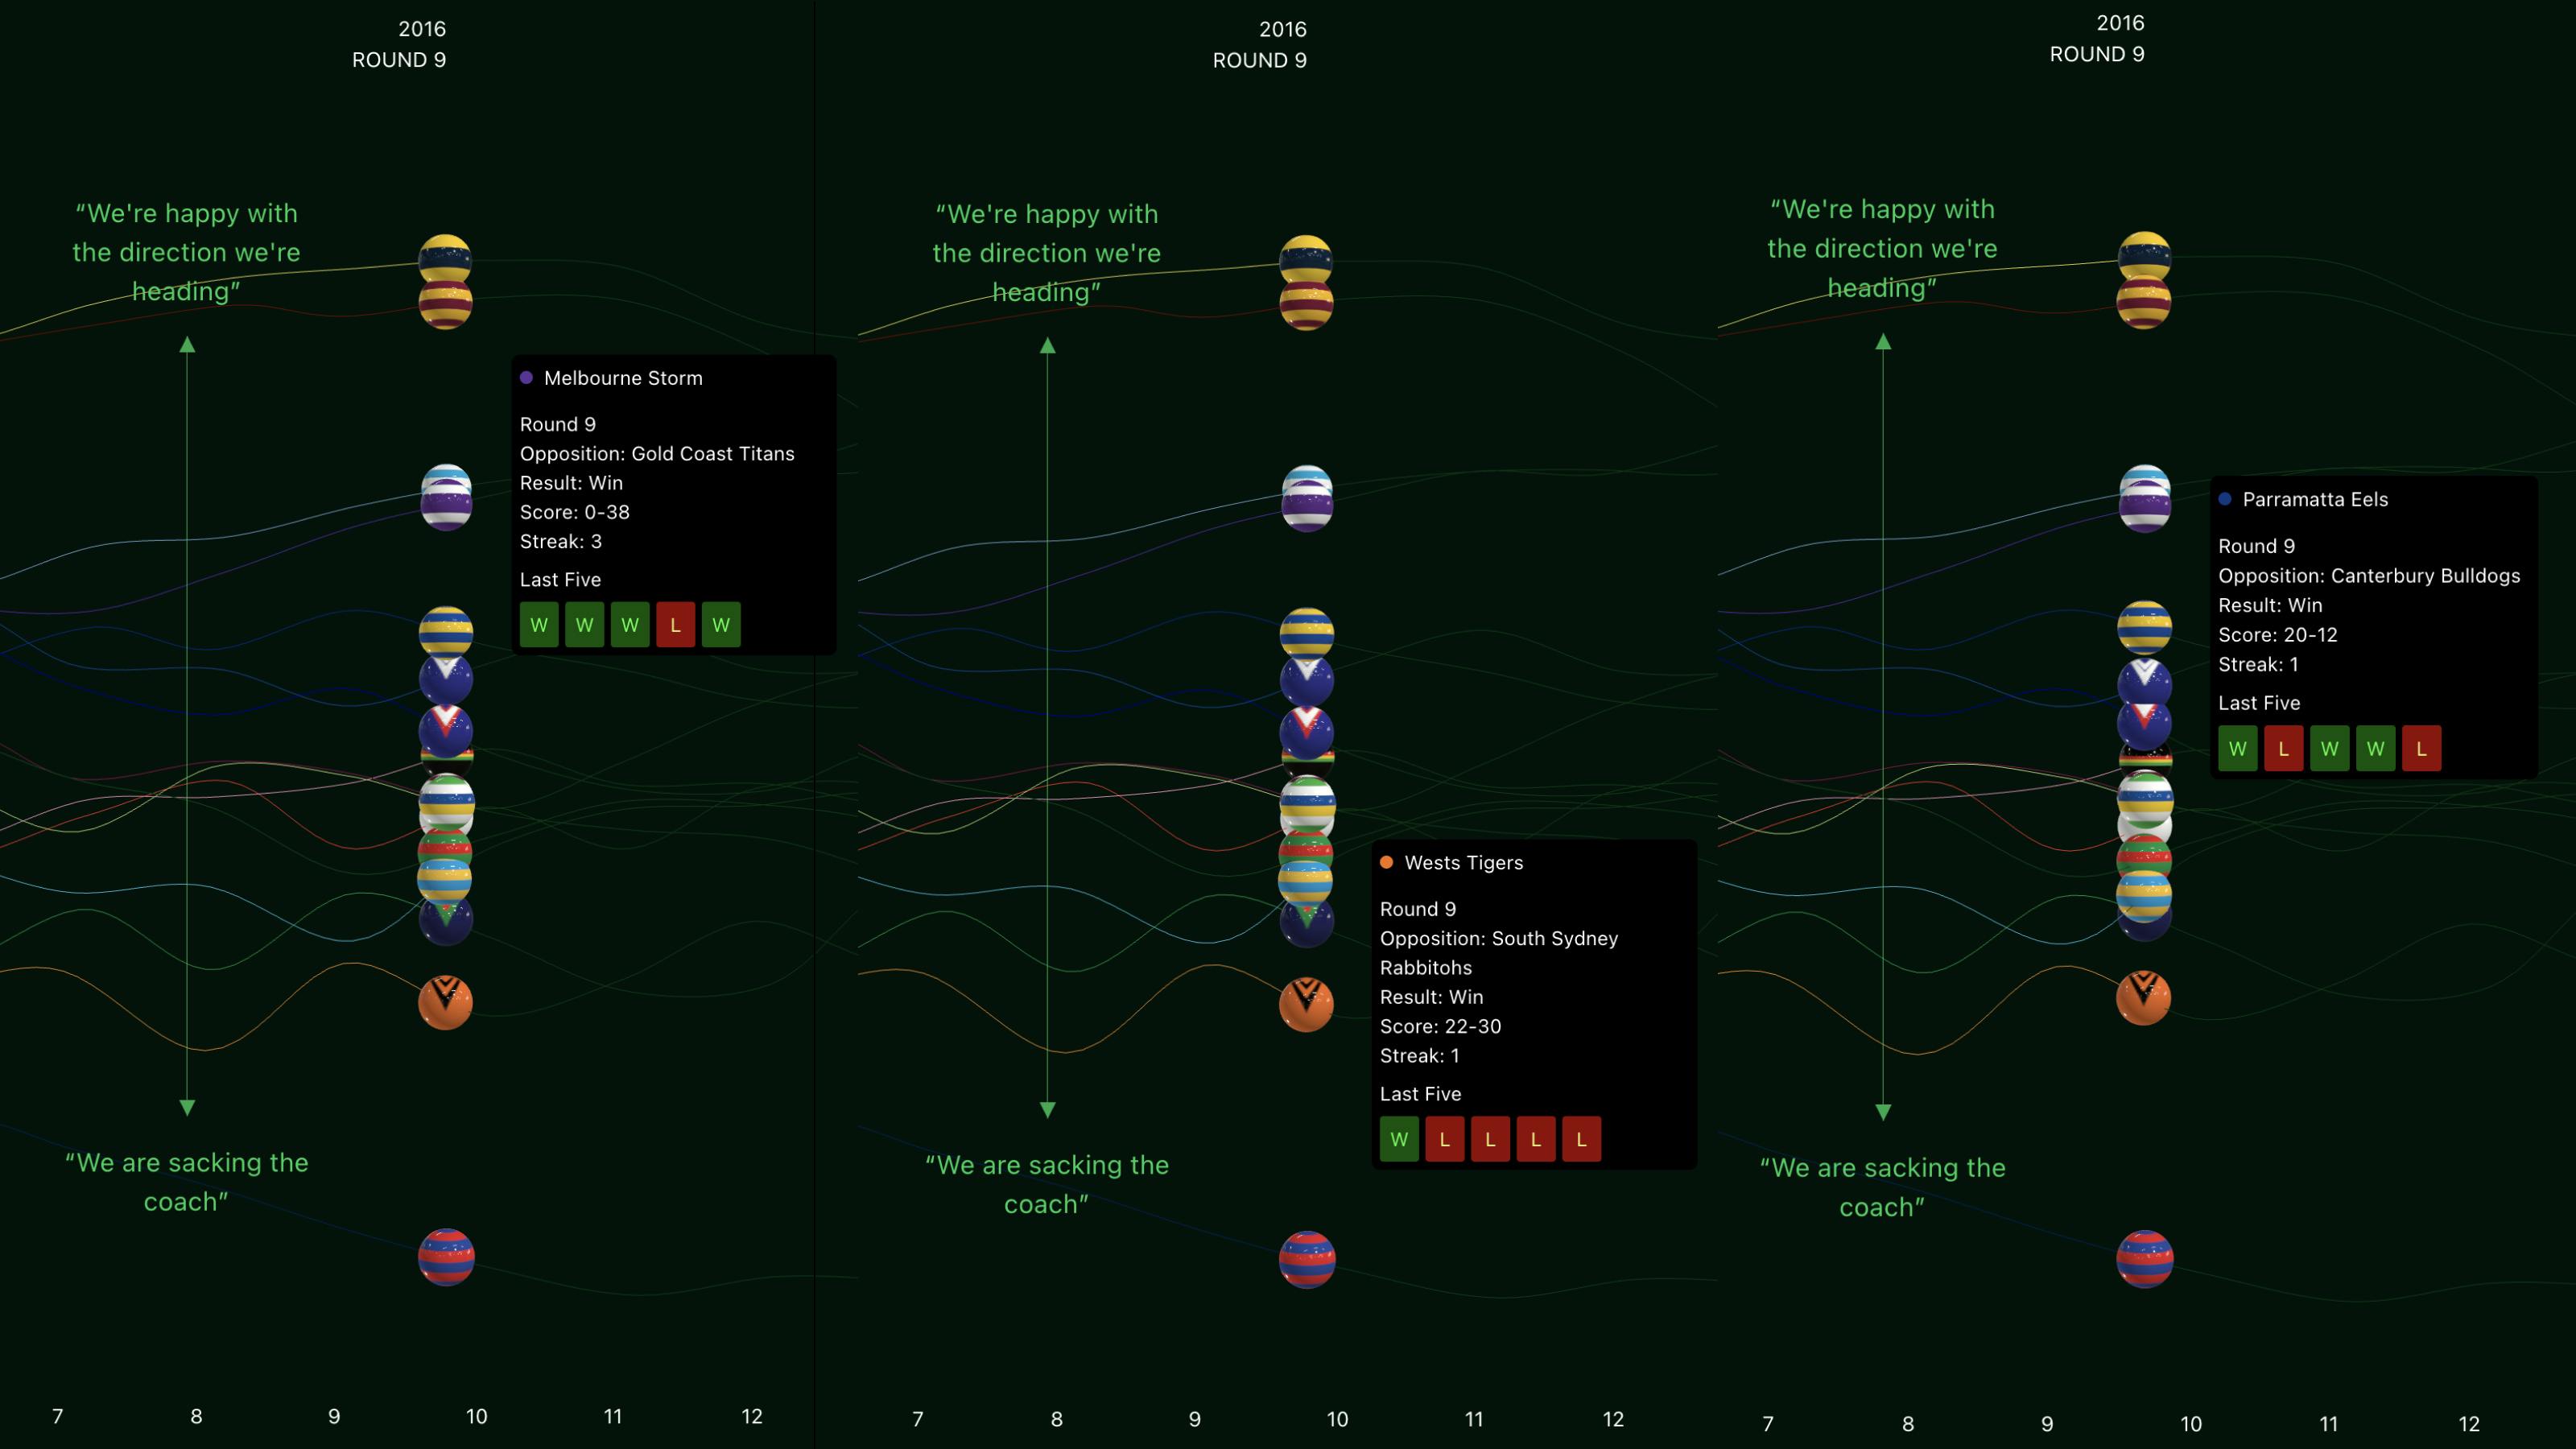
This is an iterative algorithm. To calculate the form of each team at a given point in time, we begin by assigning all teams a score of 0. We then go through each team and adjust their form score based on all previous matches. For each match we consider:

  • The winning/losing margin
  • The form of the opposition
  • The recency of the result

This process is repeated until all the form scores converge.

Interrogating data in the 3D space

Three dimensions affords us the possibility to look at data in new and interesting ways. Rotating the view allows us to have form and streak plotted by the one curve per team. Looking down the x axis allows us to see both form and streak. This becomes a unique fingerprint of the team’s performance over time. This method could be applied to many different performance indicators. It is a great method of comparison between teams and allows for a lot of data from a long period of time to be consumed in one glance.

Team performance at a given round

Using the scroll controlled timeline and showing team information at a given round with just a hover is a fluid and engaging way to explore your team’s performance. Seeing the performance of all your team’s rivals in the same view gives even more context. Many other pieces of information could be surfaced at this point in time as well that could all go towards building an even more comprehensive picture of your team’s journey.

Design

An elegant and minimal UI is paired with moments of magic when you click on your team or you come to a Grand Final. The use of hyper local team stickers is a nod to bumper bars of a supporters car. The use of 3D is what makes these moments. The maximalist floating confetti for the winner of the Grand Final and the high gloss, sticker covered spheres sit in juxtaposition to the minimal UI.

Next steps

We are currently experimenting with this format as a way to explore even more of the interesting information that makes up the story of an sports team. This format can be a story telling tool for more than just performance. We can add pieces of important history to a club’s timeline. Their player movements, coaching changes, mergers, membership numbers are all things that supporters follow avidly. We want to build a place for these key moments and data related to them to be explored in a friction-less way.

More Work

AMP
AMP Sortation

  • tag
    Visual Storytelling

We teamed up with Figure agency to create an eye-catching redesigned site as part of a rebrand for AMP, an AI-powered waste sortation toolkit.

Made with Next.js and Prismic, and deployed to Netlify - this site is a slick statement of intent, with subtle interactive animations built-in throughout and notable for its high-fidelity 3D scrolling animations. We built the site with the capacity to scale to multiple international versions and to be nearly 100% customisable for the client- with re-purposable modules available to use and reorder throughout the site.

Meta
Data Co-Design Workshop

  • tag
    Virtual Reality
  • tag
    Rapid Prototyping

The Metaverse provides designers and policy makers with many challenges. How designers responsibly request for consent to use, collect and then respond to body-based data is one of those challenges.

In conjunction with design studio Craig Walker, Supermarket was enlisted by Meta to design a co-design workshop for external privacy and technology experts which particular body-based data. The output of this work will be a published report, privacy frameworks and design patterns which aim to support industry in developing people-centred and transparent metaverse experiences for users.

As part of this workshop we built 4 XR scenarios that let users experience interactions and understand the data collected in that interaction.

These scenarios were vital to provide context to policy makers, some of whom had little experience of VR. They allowed for more informed participation, deeper exploration of solutions and better outcomes within the workshop.

Internal
Flexible Visual Systems Design Tool

  • tag
    Rapid Prototyping

“In a world of constant change, everything rigid will break. We need to unlearn static approaches and learn to see, understand and design flexible systems.” - Dr. Martin Lorenz

We came across the amazing research on Flexible Design Systems by Dr. Martin Lorenz through his recent book. This chimed with us as designer-developers delivering work that needs to be applied flexibly across various outputs. In order to extend and investigate Martin’s research, we partnered with design studio Public Websites to prototype a custom design tool using the concepts described in the book. We created a UI that could generate millions of designs through limited variations and incorporated ChatGPT to allow for text based input to populate that UI.

Meta
Privacy Enhancing Technology

  • tag
    Visual Storytelling

Meta is developing new forms of digital advertising which are less reliant on third-party data, and instead use Privacy Enhancing Technologies (PETs). These PETs protect data in new ways and improve transparency and user control. Based in cryptography and mathematics, these technologies are highly technical and often misunderstood in the industry.

Supermarket, together with Craig Walker, worked with Meta to develop beautiful, in-browser animations to explain these PETs, giving advertisers, regulators and policy-makers an understanding of how they work to protect and increase data privacy.

Internal
NRL Performance Timeline

  • tag
    Data Visualisation
  • tag
    Visual Storytelling

As an exercise in the possibilities 3D brings for data visualisation and interrogation we built a timeline that tracks the performance of all teams in the Australian based National Rugby League competition since 2015. The timeline allows users to track their team against others, interrogate the form of their team at every round, filter comparative teams in or out and see the Grand Final winners at the end of each season all in one timeline.

Meta
Personalised Advertising for People and Businesses

  • tag
    Visual Storytelling

The personalised advertising ecosystem is a major reason we can use digital services for free. Supermarket was asked by Meta to build a visual explainer showing that ecosystem works, and the value that it brings to both individuals and businesses. This explainer uses complex pinned and multi-layered web animations built using GSAP and controlled by scroll.

Highland
Fleet Builder

  • tag
    Visual Storytelling
  • tag
    Data Visualisation

As part of the launch of the new Highland brand we were asked by design studio Figure to create a scrolling interactive data visualisation to help new customers understand the savings they could make by using Highland to electrify their school bus fleet.

The user inputs data about their existing fleet, their electrification goal and their target deployment schedule. That data is then visualised and used to personalise an immersive animated journey through Highland’s product offering and process. The data then becomes part of a dynamically generated PDF for the user to take away.

Internal
Tumbling Tower

  • tag
    Virtual Reality

To celebrate the launch of the studio we created a digital tumbling tower based on a real life version created on a lazy Sunday afternoon on the living room carpet. We used physics, gravity control and some 3D typography. We turned this into a browser based VR experiment for guests to experience at our launch party. When entering this VR version users can bat away the blocks and typography with the large glass orbs that are tracked to their controllers. This VR version was built using the WebXR device API through the excellent library react-xr. Other tools and libraries used were Vectary, use-cannon & react-three-fibre.

TTC Labs
Automated Avatar Generator

  • tag
    Rapid Prototyping

Labeling is an important step in (supervised) machine learning, but is susceptible to bias. We built a tool that asked users to label three images within a workshop. The workshop was designed to demonstrate the need for diverse people, diverse labels and diverse images training AI. Workshop participants are asked to categorise and label the features on three images. These labels were then used to generate an avatar from hundreds of image assets. If consent was given the results were collected in Airtable. These results were then available to further workshops to allow bias to be examined. Airtable provided an easy to use API for submitting results to a database and the perfect interface for periodic export by the design team.

TTC Labs
Digital services for young people explainer

  • tag
    Visual Storytelling

How do we empower, protect and guide young people from different communities around the world to navigate the shifting digital landscape?

Craig Walker & TTC Labs created a series of co-creation workshops with youth leaders and policy makers in Australia, the United States and the UK, in order to create design principles informed by local contexts.

Supermarket was then asked to deliver a visual explainer as an engaging introduction to the topic for designers and general public alike. The explainer tells the stories of three personas through illustration and animation across desktop and mobile. We used complex pinned web animations built in GSAP and controlled by scroll.

TTC Labs
Trustworthy AI Experiences

  • tag
    Visual Storytelling

When people don’t understand how AI-powered digital products come up with results, they might be less likely to trust them. Designing people-centric approaches to AI explainability by driving towards greater understanding and agency can help build more trustworthy digital products and services.

TTC Labs asked Craig Walker & Supermarket to build a visual explainer as an engaging introduction to the topic and their research. We used complex web animations built in GSAP and controlled by scroll to do this.